


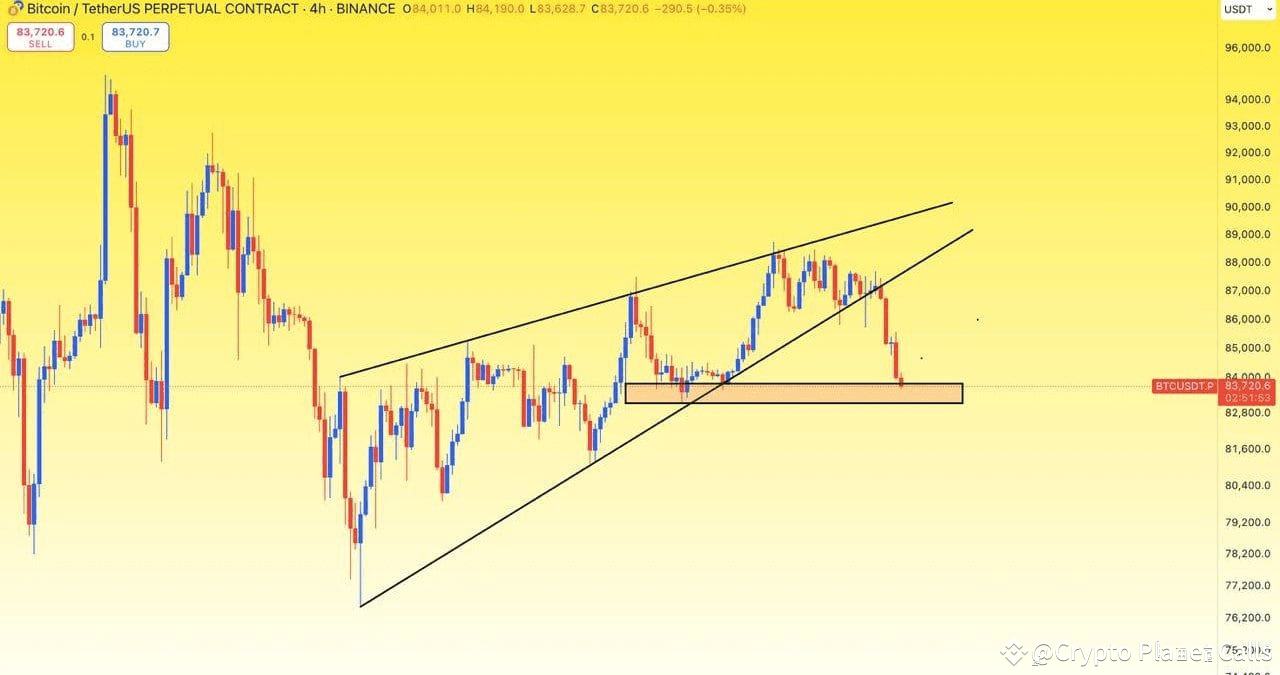
Bitcoin is holding near $80,500 on October 25, 2026, and the area around $80,000 is acting as a horizontal support line: a flat price level where buyers have repeatedly stepped in. The price is about 36% below its all-time high of roughly $126,080, momentum indicators are neutral, and volume is elevated, so both buyers and sellers are active. This article explains what a horizontal support line is, where Bitcoin’s key levels sit now, what happens if the floor holds or breaks, and how traders manage risk around it.
What is a horizontal support line?
A horizontal support line is a flat line drawn across a chart at a price where an asset has repeatedly stopped falling. Each time price drops to that level, buyers step in and push it back up. The more times the level holds, and the more volume appears around it, the more traders respect it.
There are three reasons the idea works, even though it is not a law of nature:
- Memory. Traders who bought at a level and watched it hold tend to buy there again, and those who missed it wait for another chance.
- Orders cluster. Buy orders, protective stops and options strikes pile up at obvious prices, which creates real supply and demand there.
- Self-fulfilling attention. When many traders watch the same line, their reactions help make the line matter.
The reverse also applies. When a support line breaks decisively, it often turns into resistance, because holders who bought at that level are now underwater and tend to sell when price returns to break even. This is called role reversal, and it is why a failed floor is as informative as a held one.
Where Bitcoin’s support line sits today
Bitcoin traded around $80,483 on October 25, down about 0.4% over 24 hours, according to Interactive Crypto. Different sources calculate levels differently, so the table combines several and flags the source of each.
| Level | Approx. price | What it is |
|---|---|---|
| Resistance | $83,200 | Prior week’s high (CryptoTicker, Oct 20) |
| 20-day average | $82,813 | Short-term trend line (Interactive Crypto) |
| 50-day average | $81,771 | Medium-term trend line; CryptoTicker put it near $81,580 on Oct 20 |
| Short-term resistance | $80,873 | Nearest overhead level (Interactive Crypto) |
| Spot price | $80,483 | Oct 25, 2026 |
| Short-term support | $80,329 | Nearest floor (Interactive Crypto) |
| Weekly low | $79,710 | Lowest price since Oct 14 (CryptoTicker) |
| Options max pain | $78,000 | Strike for the Oct 30 expiry |
| Put clusters | $75,000 and $70,000 | Where downside protection is concentrated |
| 200-day average | $72,850 | Long-term trend line (Interactive Crypto) |
The horizontal support line most traders refer to is the $80,000 area, with $79,710 as the nearest hard line below it. Because the nearest support and resistance are less than 1% from spot, the market is balanced on a narrow ledge.
Why the $80,000 level matters
It is a round number. Traders anchor on round prices, so $80,000 attracts orders, alerts and option strikes in a way $79,400 does not.
It has been tested repeatedly. Bitcoin slipped from about $84,000 to below $80,000 recently, recovered above $83,000 on October 13, then returned to the $80,000 area. A price near $80,380 on October 24 and a weekly low of $79,710 suggest buyers have so far defended the zone rather than letting it fall away.
Options positioning sits nearby. The October 30 monthly expiry carries about $12.1 billion in open interest, with a max-pain level of $78,000 and put strikes at $75,000 and $70,000. Hedging flows around those strikes can add friction to moves near $80,000.
Institutional flows are mixed. US spot Bitcoin ETFs recorded a $175.7 million inflow on October 13 as price recovered, after outflows of roughly $729 million on October 7 and 8. Demand is real but quick to retreat.
Some traders see a longer-term zone. One trader quoted by ChainCatcher views $80,000 to $81,000 as an accumulation area and says he is adding there. That is a single opinion without supporting data, so treat it as a viewpoint rather than evidence.
What the indicators say
The technical picture is mixed, which fits a market sitting on a support line without a clear winner.
- RSI (14-day): 43.28. This is neutral, neither oversold (below 30) nor overbought (above 70). It leans slightly weak but leaves room in both directions.
- Short-term averages: below. Price is under the 20-day (about $82,813) and 50-day (about $81,771) averages, which reflects the pullback of the past few weeks.
- Long-term average: above. Price remains well above the 200-day average near $72,850, which keeps the longer uptrend intact for now.
- Returns: weak. Bitcoin is down about 1.6% over five days and 6.9% over 20 days.
- Volume: elevated. Volume is about 1.56 times its 30-day average, which suggests active disagreement at this level rather than apathy.
- Volatility: unusually low. Deribit’s 30-day implied volatility index recently touched its lowest reading since March 2021, so large moves are not being priced in, even though price is sitting on a key level.
Taken together, the indicators neither confirm a bounce nor warn of a collapse. They say the line is being tested and the decision is still pending. Note that most of these figures come from a single analytics page with delayed data, so verify them on a live chart.
If support holds: the bullish case
A floor that keeps holding builds credibility, and a bounce from it gives traders a clear, low-risk reference point. For the bullish case to gain strength, watch for these signs:
- A daily close back above $81,771, the 50-day average, which would show buyers regaining the medium-term trend.
- A push through $83,200, the prior week’s high, ideally on rising volume.
- Consecutive ETF inflow days, not a single session. Analysts have cautioned that one positive day rarely changes a trend.
- RSI moving back above 50, a sign momentum has shifted from weak to constructive.
If those line up, the next reference areas are the 20-day average near $82,813 and the $85,000 to $86,000 zone, where Bitcoin peaked on October 6. Some options traders have positioned for $90,000 and beyond, but those strikes are wishes rather than forecasts.
The bullish case also benefits from the fact that sentiment is subdued. Funding rates have been mild and implied volatility is near multi-year lows, so a rally would not be fighting a crowded long trade.
If support breaks: the bearish case and the next floors
Support is not guaranteed. Each retest tends to weaken a level, because the buyers who defended it have already used some of their orders. A decisive break would show up as a daily close below roughly $79,700, ideally with high volume, rather than a brief wick under the line that quickly recovers.
If the floor gives way, these are the next areas traders would watch:
| Level | Why it matters |
|---|---|
| $78,000 | Max-pain strike for the October 30 options expiry |
| $75,000 | Large put cluster and a round number |
| $72,850 | Approximate 200-day average, the long-term trend line |
| $70,000 | Second put cluster and a major round number |
A broken $80,000 would also flip into resistance. Traders who bought around that level would be tempted to sell into any rebound, which can cap recoveries near $80,000 to $81,000.
The options market has priced roughly an 11% move for the month, or a range of about $72,500 to $90,400. A drop to the lower part of that range would be within expectations, not a shock. Bearish confirmation would include ETF outflow streaks similar to those of October 7 and 8, a risk-off turn in stocks or a hawkish macro surprise.
How traders use a horizontal support line
Experienced traders treat a support line as a zone and a decision point, not a promise. A common approach looks like this:
- Draw the line from several touches. A level tested at least two or three times carries more weight than a single swing low. Use a band of 1% or so rather than an exact price.
- Prefer closing prices over wicks. A candle that dips below the line but closes above it signals a rejection. A daily close below it signals a break.
- Check volume. A bounce on rising volume is more convincing than one on thin volume. A breakdown on heavy volume is more concerning than one on light volume.
- Define the invalidation point first. Decide the price at which your idea is wrong, for example a daily close below $79,700, and place any protective stop beyond it so normal noise does not trigger it.
- Size the position to the stop. The distance between entry and invalidation, not enthusiasm, determines how much to risk. Many traders cap risk at a small percentage of their account on any single idea.
- Avoid heavy leverage. At 10x leverage, liquidation sits roughly 10% from entry, which is close to the month’s expected move, and a stop-run through a crowded level can wipe the position out.
- Scale in and out. Splitting entries around the line avoids betting everything on one touch.
- Confirm with other signals. Support lines work best when they coincide with moving averages, ETF flows or options levels.
The limits of support lines
Support lines are useful maps, but they have real weaknesses.
- They are subjective. Two traders can draw different lines on the same chart, and a level that looks obvious in hindsight may be ambiguous in real time.
- Obvious levels get hunted. Large players can push price through a crowded line to trigger stops, then reverse. Stops placed exactly at $80,000 are the easiest to hit.
- They weaken with repeated tests. Each touch can use up buy orders, so a long-held floor may be closer to failing, not safer.
- They ignore news. A regulatory announcement, a macro surprise or a large liquidation can overwhelm any technical level in minutes.
- They say nothing about value. A price can hold a support line and still be expensive or cheap relative to anything fundamental.
The sensible way to use a support line is as one input, alongside risk limits and a view of the wider market, never as a guarantee.
This article is educational and not financial, tax or legal advice. Crypto is volatile and you can lose money. Technical levels are approximate and change constantly.
Frequently asked questions
What is horizontal support in Bitcoin trading? It is a flat price level, such as $80,000, where Bitcoin has repeatedly stopped falling because buyers stepped in.
Where is Bitcoin support right now? The $80,000 area is the main reference, with about $80,329 as short-term support and $79,710 as the weekly low. Below that, traders watch $78,000, $75,000 and the 200-day average near $72,850.
What happens if Bitcoin breaks support? A daily close clearly below the line, especially on high volume, can open a move toward the next level down, and the broken support often becomes resistance.
How reliable is horizontal support? It is a probability tool, not a guarantee. Levels with several tests and supporting signals are more reliable, but all can fail.
What is the difference between support and resistance? Support is a price floor where buying tends to appear. Resistance is a price ceiling where selling tends to appear. A broken support often turns into resistance.
Is Bitcoin a buy at support? This article cannot say, because that depends on your finances and risk tolerance. Traders typically combine a support level with a defined invalidation price and a position size they can afford to lose.
