


Trading View Bitcoin analysis has emerged as one of the most powerful resources for both novice and experienced traders looking to navigate the complexities of cryptocurrency markets with confidence and precision. Trading View has revolutionized how traders approach Bitcoin technical analysis by offering a comprehensive platform that combines sophisticated charting capabilities, real-time data, and a vibrant community of traders sharing insights.
Whether you’re a day trader looking to capitalize on short-term price fluctuations or a long-term investor building a strategic position, understanding how to leverage Trading View for Bitcoin analysis is essential for making informed decisions in today’s competitive market environment. The beauty of using Trading View for Bitcoin trading lies in its accessibility and depth. The platform caters to everyone from beginners taking their first steps into cryptocurrency trading to seasoned professionals managing substantial portfolios. With customizable charts, hundreds of technical indicators, and the ability to backtest strategies, Trading View has become the go-to solution for traders seeking to gain an edge in the Bitcoin market.
What Makes Trading View the Premier Choice for Bitcoin Traders
Trading View has established itself as the industry standard for cryptocurrency charting software, and for good reason. The platform offers an unmatched combination of features that specifically benefit Bitcoin traders. The interface is intuitive yet powerful, allowing users to analyze price action across multiple timeframes simultaneously while drawing on a vast library of technical indicators and drawing tools.
One of the most significant advantages of using Trading View Bitcoin charts is the platform’s real-time data accuracy. In the cryptocurrency market, where prices can change dramatically within seconds, having access to reliable, up-to-the-minute information is crucial. Trading View aggregates data from numerous exchanges, providing traders with a comprehensive view of Bitcoin’s price action across the global market landscape.
The platform’s social features also set it apart from competitors. Traders can follow experienced analysts, share their own chart analyses, and engage in discussions about market trends. This collaborative environment creates a learning ecosystem where traders of all skill levels can improve their understanding of Bitcoin price movements and refine their trading strategies through exposure to diverse perspectives and analytical approaches.
Essential Features for Bitcoin Technical Analysis on Trading View
When conducting Bitcoin market analysis on Trading View, traders have access to an impressive array of tools designed to identify patterns, trends, and potential trading opportunities. The charting interface supports multiple chart types, including candlestick, line, bar, and Heikin Ashi charts, each offering unique insights into price behavior and market sentiment.
Technical indicators form the backbone of most trading view Bitcoin strategies. The platform offers over 100 built-in indicators, including moving averages, RSI, MACD, Bollinger Bands, and Fibonacci retracements. These tools help traders identify support and resistance levels, gauge momentum, spot overbought or oversold conditions, and predict potential price reversals. Advanced users can even create custom indicators using Pine Script, Trading View’s proprietary programming language.
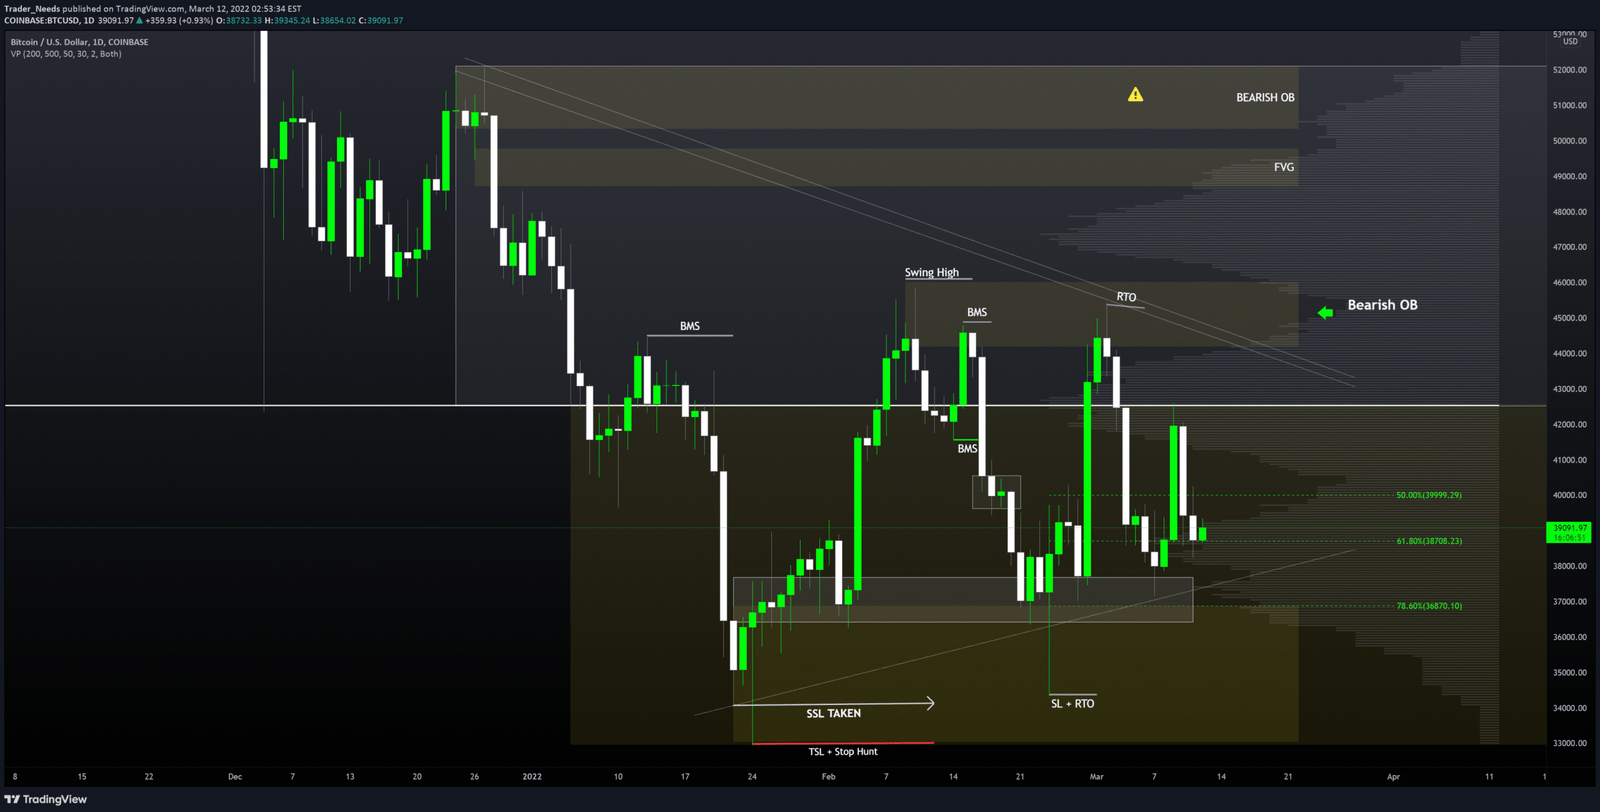
Drawing tools are equally important for Bitcoin analysis. Traders can mark trendlines, chart patterns, and key price levels directly on their charts. The ability to save and revisit these annotations makes it easy to track how your analysis evolves over time and assess the accuracy of your predictions. For those studying Bitcoin price patterns, these visual tools are invaluable for recognizing formations like head and shoulders, triangles, flags, and double tops or bottoms.
From Scalping to Long-Term Investing
One of Trading View’s most powerful capabilities for Bitcoin traders is the ability to analyze multiple timeframes simultaneously. This multi-timeframe analysis is crucial because Bitcoin’s price action often tells different stories depending on whether you’re looking at a one-minute chart or a monthly chart. Understanding how to align these perspectives is key to developing a comprehensive trading strategy.
Short-term traders using Trading View Bitcoin indicators might focus on five-minute to hourly charts to identify quick entry and exit points. These traders rely heavily on momentum indicators and volume analysis to catch rapid price movements. The platform’s alert system allows scalpers and day traders to set notifications for specific price levels or indicator conditions, ensuring they never miss critical opportunities even when they’re away from their screens.
Swing traders typically analyze daily and four-hour charts to identify medium-term trends lasting from several days to several weeks. This approach to cryptocurrency trading analysis requires patience and a focus on larger market structures rather than short-term noise. Trading View’s ability to overlay multiple indicators and save chart templates makes it easier to maintain consistency in your analytical approach across different trading sessions.
Long-term investors benefit from studying weekly and monthly Bitcoin charts on Trading View. These higher timeframes reveal the broader market cycles and help identify major support and resistance zones that have held significance over extended periods. For those building positions over months or years, these macro perspectives are essential for understanding Bitcoin’s long-term trajectory and identifying optimal accumulation zones.
Volume Analysis and Market Depth Insights
Volume is often called the fuel that powers price movements, and Trading View Bitcoin volume analysis provides crucial context for understanding the strength behind price trends. When Bitcoin’s price moves on high volume, it suggests strong conviction from market participants, making the move more likely to continue. Conversely, price movements on low volume may indicate weak trends susceptible to reversal.
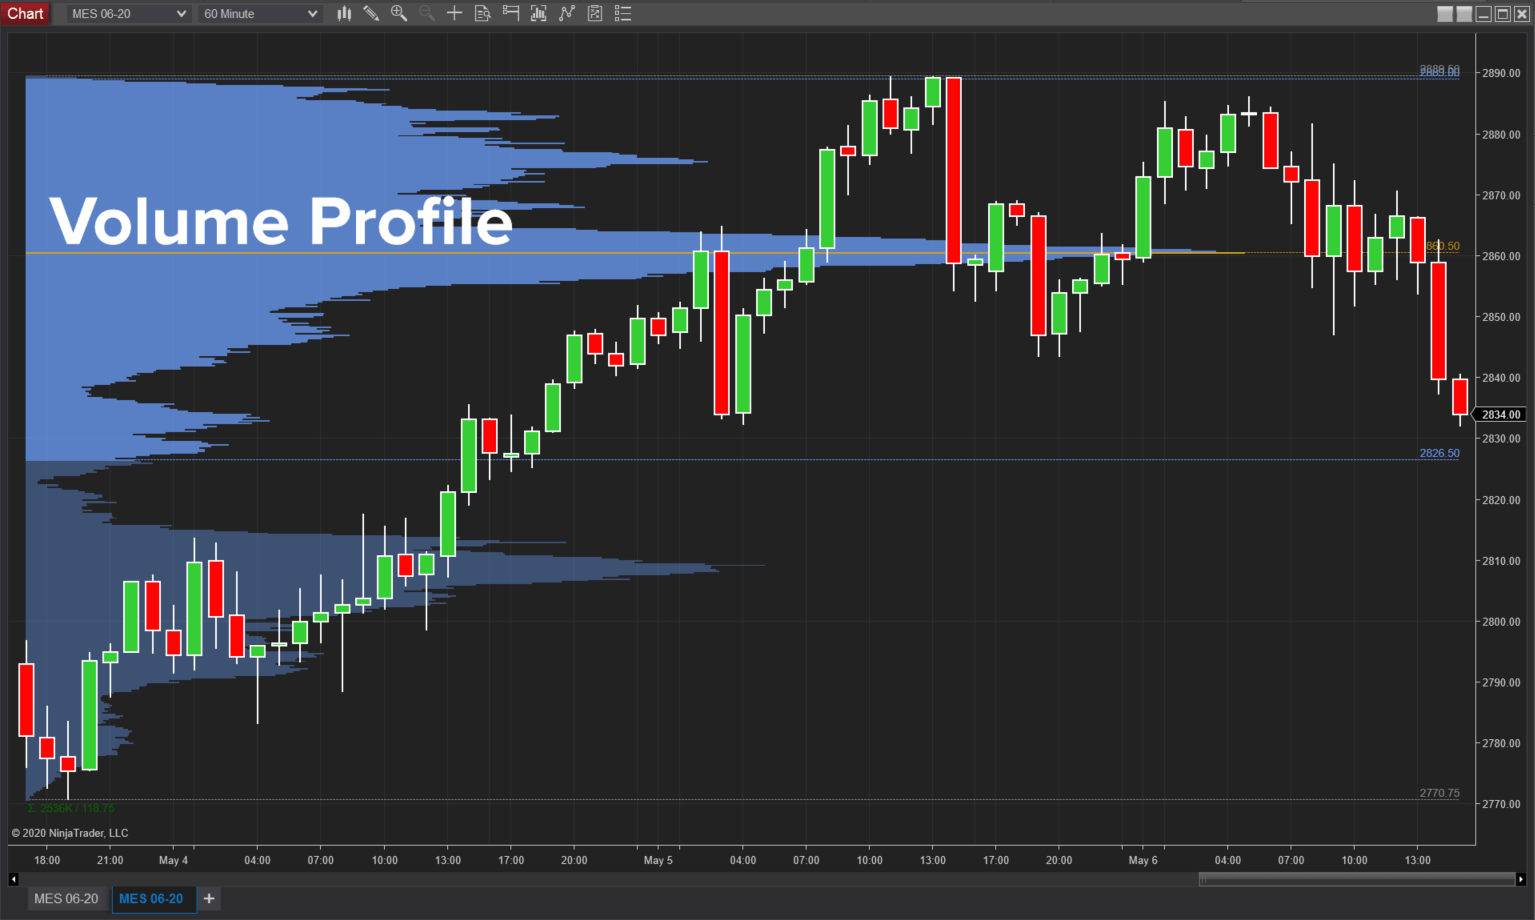
Trading View displays volume data at the bottom of charts by default, but traders can enhance their analysis by adding volume-based indicators like the Volume Profile, On Balance Volume (OBV), or Volume Weighted Average Price (VVAP). These tools help identify where the most trading activity has occurred and can reveal important support and resistance levels that aren’t immediately obvious from price action alone.
Understanding Bitcoin trading volume patterns can also help traders anticipate potential breakouts. When Bitcoin consolidates in a tight range with declining volume, it often precedes a significant price movement. Trading View’s alert system can notify traders when volume spikes above certain thresholds, potentially signaling the beginning of a new trend or the exhaustion of an existing one.
Indicator Combinations for Effective Bitcoin Trading Strategies
Successful traders rarely rely on a single indicator when analyzing Bitcoin markets. Instead, they develop trading view Bitcoin analysis systems that combine multiple indicators to confirm signals and reduce false positives. This multi-indicator approach provides a more comprehensive view of market conditions and increases the probability of successful trades.
A popular combination involves using moving averages alongside momentum oscillators. For example, traders might use the 50-day and 200-day moving averages to identify the overall trend direction while employing the RSI to determine whether Bitcoin is overbought or oversold within that trend. When these indicators align, they provide stronger signals than either would individually.
Another effective strategy combines trend-following indicators with volatility measures. Traders might use the MACD to identify trend changes while monitoring Bollinger Bands to assess volatility levels. When Bitcoin’s price touches the lower Bollinger Band during an uptrend identified by the MACD, it might represent a buying opportunity. Trading View makes it easy to experiment with different indicator combinations and backtest them against historical data to determine their effectiveness.
Pattern Recognition and Chart Analysis Techniques
Bitcoin chart patterns have provided traders with valuable insights for years, and Trading View’s drawing tools make identifying and trading these formations straightforward. Classic patterns like head and shoulders, double tops and bottoms, triangles, wedges, and flags appear regularly in Bitcoin’s price action and can offer high-probability trading opportunities when properly identified.
Candlestick patterns also play a crucial role in trading view Bitcoin technical analysis. Formations like doji, hammer, shooting star, engulfing patterns, and morning stars can signal potential reversals or continuation of trends. Trading View’s zoom and pan features make it easy to examine these patterns in detail across different timeframes, helping traders understand their context within the broader market structure.
Support and resistance levels represent another critical component of chart analysis. These price levels where Bitcoin has historically struggled to move above or below often act as turning points for future price action. Trading View allows traders to mark these levels with horizontal lines and extend them into the future, creating a roadmap for potential price targets and risk management levels.
Alert Systems and Automation for Bitcoin Traders
One of Trading View’s most practical features for active Bitcoin traders is its comprehensive alert system. Rather than staring at charts all day, traders can set alerts based on price levels, indicator conditions, or custom criteria defined using Pine Script. When these conditions are met, Trading View sends notifications through the browser, email, or mobile app, ensuring traders never miss important market developments.
Price alerts are the most straightforward type, triggering when Bitcoin reaches a specific value. These are useful for monitoring key support and resistance levels or potential entry and exit points. However, the true power of Trading View’s alert system lies in its ability to create complex, multi-condition alerts that only trigger when multiple criteria are satisfied simultaneously.
For example, a trader could create an alert that triggers only when Bitcoin’s price crosses above the 50-day moving average while the RSI is below 70 and volume exceeds its 20-day average. This type of sophisticated filtering helps reduce noise and ensures traders only receive notifications for the most promising setups. This automated Bitcoin analysis capability saves time and mental energy while improving trading efficiency.
Community Features and Social Trading Benefits

Trading View’s social platform represents a unique aspect of the service that significantly enhances the Bitcoin trading experience. Thousands of traders and analysts publish their chart analyses, trading ideas, and market commentary daily, creating a rich repository of perspectives on Bitcoin’s price action. This community-driven approach to market analysis offers learning opportunities that extend far beyond what any individual trader could achieve alone.
Following experienced Bitcoin analysts on Trading View allows traders to see how professionals approach market analysis, what indicators they prioritize, and how they manage risk. Many top contributors share detailed explanations of their reasoning, helping followers understand not just what they think will happen but why. This educational component is invaluable for developing your own analytical skills and Bitcoin trading strategies.
The platform’s reputation system, which awards credibility scores based on the accuracy of published predictions, helps users identify analysts worth following. This social validation mechanism creates accountability and encourages high-quality analysis. Traders can also participate in the community by publishing their own ideas, receiving feedback, and refining their analytical approach through constructive dialogue with peers.
Mobile Trading and Cross-Platform Synchronization
Modern Bitcoin trading doesn’t confine itself to desktop computers, and Trading View recognizes this reality with robust mobile applications for iOS and Android devices. These apps provide nearly the full functionality of the desktop platform, allowing traders to monitor positions, conduct technical analysis, and execute trades from anywhere with an internet connection.
The synchronization between desktop and mobile versions ensures that all your charts, indicators, watchlists, and alerts remain consistent across devices. A chart you create on your desktop computer appears identically on your smartphone, maintaining all indicators, drawings, and settings. This seamless cross-platform experience means you can begin your analysis at home and continue it on the go without missing a beat.
For Bitcoin traders who need to monitor the market constantly, this mobile accessibility is invaluable. Whether you’re commuting, traveling, or simply away from your primary trading setup, you can stay connected to Bitcoin’s price movements and respond to opportunities or risks as they develop. The mobile app’s alert notifications ensure you’re immediately informed of important market developments regardless of your location.
Risk Management Tools and Position Sizing
Successful Bitcoin trading isn’t just about identifying profitable opportunities; it’s equally about managing risk to protect capital during inevitable losing trades. Trading View provides several features that support disciplined risk management practices. Traders can mark stop-loss and take-profit levels directly on their charts, visualizing the risk-reward ratio for each potential trade before committing capital.
The platform’s position calculator helps traders determine appropriate position sizes based on their account size, risk tolerance, and the distance between entry and stop-loss levels. This mathematical approach to position sizing removes emotion from the equation and ensures that no single trade can cause catastrophic portfolio damage. For Bitcoin’s volatile market, where 10% daily moves aren’t uncommon, this disciplined approach to risk management is essential.
Paper trading functionality allows new traders to practice their strategies without risking real money. Trading View’s demo account provides access to all features using simulated funds, letting users test indicator combinations, practice pattern recognition, and develop their trading psychology before transitioning to live markets. This risk-free learning environment accelerates the development of profitable trading skills.
Integration with Cryptocurrency Exchanges
While Trading View excels as an analytical platform, many traders also appreciate its integration capabilities with major cryptocurrency exchanges. Through these integrations, traders can execute trades directly from Trading View charts without switching between multiple platforms. This streamlined workflow reduces friction and enables faster response times to market opportunities.
The integration supports not only order placement but also portfolio tracking, allowing traders to monitor their Bitcoin positions alongside their technical analysis. Real-time updates on open orders, fills, and account balances provide comprehensive oversight of trading activity. This unified approach to Bitcoin portfolio management simplifies the trading process and reduces the cognitive load associated with managing multiple platforms simultaneously.
Different subscription tiers offer varying levels of exchange integration features, with higher tiers providing access to more advanced order types and multiple simultaneous exchange connections. For active traders managing positions across several exchanges, these integration capabilities can significantly improve operational efficiency and reduce the likelihood of errors associated with manual order entry.
Conclusion
Trading View Bitcoin analysis represents far more than just looking at charts; it’s about developing a comprehensive understanding of market dynamics, mastering technical analysis tools, and making informed decisions based on data rather than emotion. The platform’s combination of powerful features, educational resources, and community insights creates an environment where traders can continuously improve their skills and adapt to the ever-changing cryptocurrency landscape.
Whether you’re just beginning your Bitcoin trading journey or you’re a seasoned professional seeking to refine your approach, Trading View provides the tools necessary for success. The key is to approach the platform methodically, gradually building your technical analysis skills, testing strategies thoroughly, and maintaining disciplined risk management practices. Remember that consistent profitability in Bitcoin trading comes from edge accumulation over many trades, not from seeking the perfect single trade.
As the cryptocurrency market continues to mature and evolve, having sophisticated analytical capabilities becomes increasingly important for maintaining a competitive advantage. Trading View’s ongoing development and feature additions ensure that traders have access to cutting-edge tools for Bitcoin market analysis. By investing time in mastering this platform, you’re equipping yourself with skills and capabilities that will serve your trading career for years to come.
FAQs
Q: Is Trading View free for Bitcoin trading analysis?
Trading View offers a free tier with basic features that’s sufficient for casual traders and those just beginning to learn technical analysis. However, serious Bitcoin traders typically benefit from paid subscriptions that unlock additional indicators per chart, more saved chart layouts, extended historical data, and faster data refresh rates. The Pro and Pro+ tiers represent excellent value for active traders who need professional-grade analytical capabilities.
Q: Can Trading View predict Bitcoin price movements accurately?
Trading View itself doesn’t predict Bitcoin prices; it’s a tool that provides data and analytical capabilities that traders use to form their own predictions. The accuracy of any Bitcoin price forecast depends on the trader’s skill in interpreting technical indicators, recognizing patterns, and understanding market context. Even the most experienced analysts using Trading View cannot predict price movements with certainty, as cryptocurrency markets are influenced by countless variables and remain inherently unpredictable.
Q: What are the best Trading View indicators for Bitcoin day trading?
The optimal indicator combination varies by trading style and market conditions, but popular choices for Bitcoin day trading include the EMA (Exponential Moving Average) for trend identification, RSI for momentum assessment, MACD for detecting trend changes, and volume indicators for confirming price movements. Many successful day traders combine three to five complementary indicators rather than relying on a single tool, creating a holistic view of market conditions.
Q: How do I create custom alerts for Bitcoin price movements on Trading View?
Creating alerts on Trading View is straightforward. Click the alarm clock icon at the top of your chart, then select your alert conditions. You can set alerts for simple price levels or create complex multi-condition alerts using indicator values and logical operators. After defining your conditions, choose your notification method (browser, email, or mobile app) and save the alert. The platform will monitor the market continuously and notify you when your specified conditions are met.
Q: Does Trading View provide real-time Bitcoin data from all exchanges?
Trading View aggregates data from numerous cryptocurrency exchanges, providing comprehensive coverage of Bitcoin trading activity globally. However, the exact exchanges included and the speed of data updates vary by subscription tier. Free accounts typically receive delayed data, while paid subscriptions offer real-time or near-real-time feeds. For the most accurate information about which specific exchanges are covered for Bitcoin trading, consult Trading View’s current exchange list in their documentation.