



A solid Chainlink trading strategy begins with understanding what moves the asset. Chainlink is a decentralized oracle network that delivers real-world data to smart contracts, and its LINK token is used to pay node operators. Because many DeFi platforms depend on this data, LINK often reacts to sector-wide sentiment as well as its own news. Traders who rely on guesswork usually struggle, while those who follow a defined plan tend to stay more consistent. In this guide from cryptofylab.com, we break down breakout zones, helpful indicators, and risk levels so you can build a repeatable process. Remember that no method wins every trade, and this is educational content, not financial advice.
Understanding LINK Before You Trade It
Before building any Chainlink trading strategy, you should know why LINK moves. Its price responds to broader crypto market direction, to DeFi activity, and to developments such as new integrations or cross-chain tools. Bitcoin’s trend often sets the tone, so LINK can struggle during weak markets even when its own fundamentals look healthy. Liquidity is generally good on major exchanges, which helps with clean entries and exits. Still, sudden spikes in volume can create fast moves and false signals. Understanding the project and its market behavior gives context to chart patterns, allowing you to judge whether a setup fits the current environment or looks like noise.
Fundamentals That Influence LINK Price
Network adoption is a key driver. When more protocols integrate Chainlink price feeds, proof-of-reserve services,s or cross-chain messaging, investor interest can rise. Announcements about partnerships with financial institutions also tend to draw attention, although the market sometimes prices in good news before it arrives. Staking developments and token supply schedules matter too, because they affect how much LINK is available to trade. Traders should follow official project updates and avoid relying on rumors. A Chainlink trading strategy that blends technical analysis with an awareness of fundamental catalysts usually has better context, helping you avoid entering trades just before major events that could create unexpected volatility.
Correlation With Bitcoin and the Altcoin Market
LINK frequently moves with Bitcoin and the wider altcoin sector. When Bitcoin falls sharply, many altcoins fall harder, while strong Bitcoin rallies can lift them with a delay. Checking Bitcoin’s trend before taking a LINK position is therefore a smart habit. You can also compare LINK against ETH, since the two assets are closely tied to smart contract activity. If LINK holds up well while the market drops, that relative strength can be a positive sign. If it falls faster than peers, caution may be wise. Using correlation as a filter strengthens any Chainlink trading strategy and prevents trading in isolation from the wider market.
Finding Breakout Zones on the LINK Chart
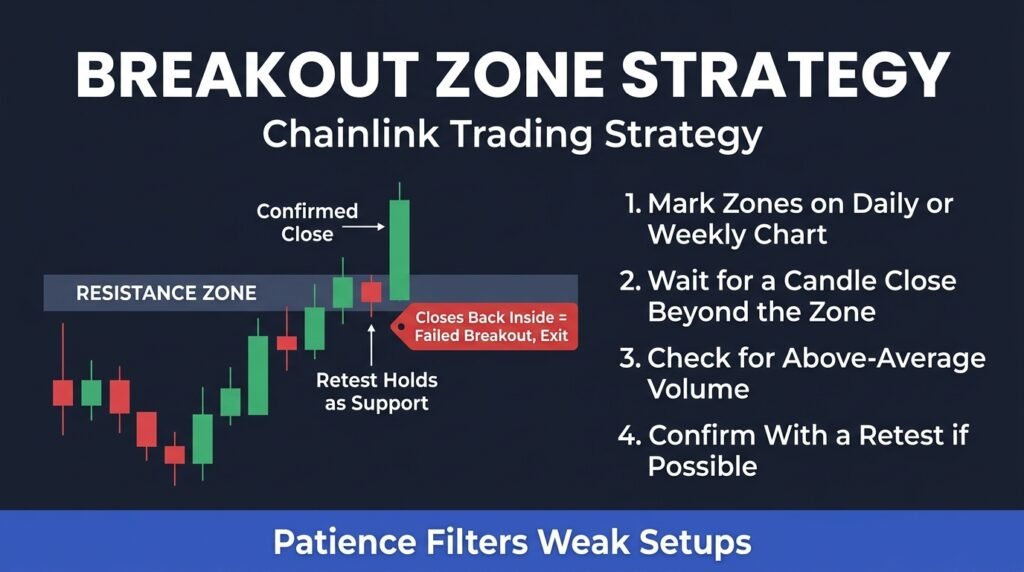
Breakout zones are areas where price has repeatedly struggled to move beyond, creating resistance, or repeatedly bounced from, creating support. A breakout happens when price closes decisively beyond one of these levels, often with higher volume. For a Chainlink trading strategy, identifying these zones on higher timeframes such as the daily or weekly chart gives more reliable reference points than short-term charts. Mark horizontal levels where price reversed multiple times and note consolidation ranges. The longer a range lasts, the more meaningful a breakout may be. However, many breakouts fail, so traders should wait for confirmation and always have a plan if the move reverses.
Drawing Support and Resistance Levels
Start by zooming out to see major turning points, then draw horizontal lines at those levels. Treat them as zones rather than exact prices, because markets rarely respect a single number. A zone might span a few percent around the level, accounting for wicks and noise. Levels become stronger when they have been tested several times or when they align with round numbers and previous highs or lows. Once marked, these zones help you plan entries, stops, ps and targets before emotions interfere. A Chainlink trading strategy built on clear levels is easier to follow because you already know in advance where you would be wrong and where you might take profit.
Confirming a Breakout and Avoiding Fakeouts
Fakeouts trap traders who enter the moment price touches a level. To reduce this risk, wait for a candle to close beyond the zone, preferably with above-average volume. Some traders also wait for a retest, where price returns to the broken level and holds it as new support. This approach may mean a slightly worse entry but often provides a safer stop placement. If price quickly falls back inside the old range, treat it as a failed breakout and exit according to your plan. Patience and confirmation are core principles in any Chainlink trading strategy, because they help filter weak setups from stronger, higher-probability opportunities.
Indicators That Support a Chainlink Trading Strategy
Indicators do not predict the future, but they can confirm what the chart already suggests. Used sensibly, they help measure momentum, trend direction, and volatility. The danger is adding too many tools, which creates conflicting signals and confusion. Most disciplined traders choose two or three indicators and learn them well. For a practical Chainlink trading strategy, a combination of moving averages, RSI, and volume offers a balanced view. Always test settings on past charts before risking real money, and remember that indicators lag behind price, so they work best as confirmation rather than as stand-alone triggers.
Moving Averages and Trend Direction
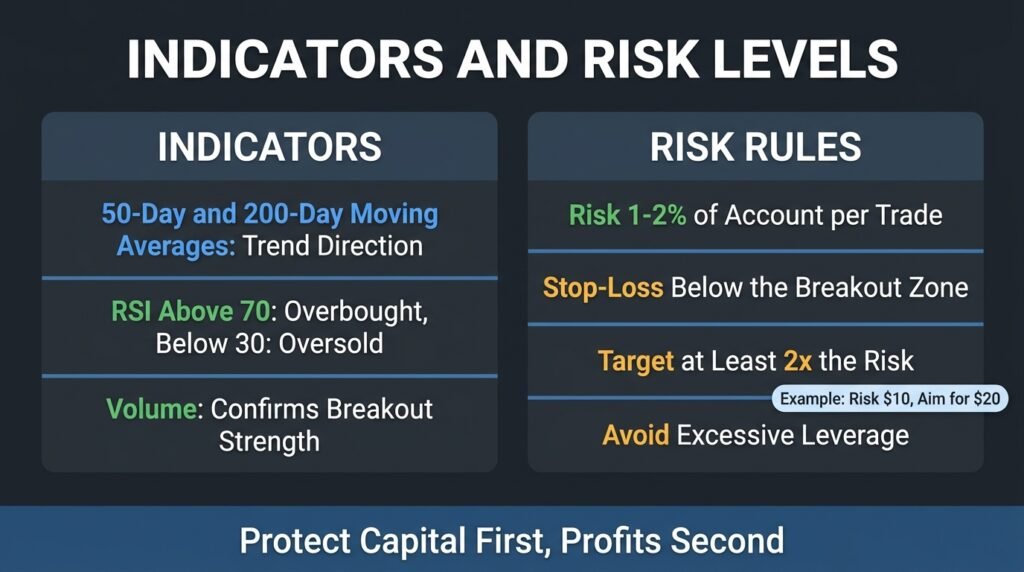
Moving averages smooth price data and reveal the underlying trend. The 50-day and 200-day averages are widely watched, and many traders consider price above both a sign of bullish structure. Crossovers between shorter and longer averages can signal shifts in momentum, although they sometimes appear late. Averages can also act as dynamic support during healthy uptrends, with price bouncing near them. In a Chainlink trading strategy, you might only look for long breakouts when price trades above a key average, filtering out trades against the main trend. This simple rule can improve consistency and help you avoid fighting strong downward pressure.
RSI, Volume and Momentum Confirmation
The Relative Strength Index measures momentum on a scale from zero to one hundred. Readings above seventy are often considered overbought, while readings below thirty suggest oversold conditions, though strong trends can stay extreme for long periods. Many traders use RSI to spot divergence, where price makes a new high but momentum does not. Volume adds another layer, because a breakout with rising volume carries more conviction than one with weak participation. Together, these tools help validate setups within a Chainlink trading strategy. You can learn more about indicator basics from educational resources such as Investopedia, then practice on historical charts before applying them live.
Risk Management and Risk Levels for LINK
Risk management matters more than any entry signal. Even a strong Chainlink trading strategy will produce losing trades, and survival depends on keeping losses small. Decide how much of your account you are willing to risk per trade, commonly one to two percent, and size positions accordingly. Avoid excessive leverage, since a small adverse move can liquidate a leveraged position. Write your plan before entering, including stop-losstargetsaets and conditions for exiting. Following rules mechanically reduces emotional decisions, which are a leading cause of losses. Traders who protect capital stay in the game long enough to benefit when good setups appear.
Setting Stop-Loss and Take-Profit Levels
A stop-loss should sit where your trade idea is clearly invalid, such as just below a breakout zone or recent swing low. Placing it too tight risks being stopped out by normal volatility, while placing it too wide increases the loss. Take-profit targets can be set at the next resistance zone or based on a risk-to-reward ratio, such as at least two times the amount risked. Some traders scale out, selling part of the position at the first target and trailing the stop on the rest. Defining these levels in advance turns your Chainlink trading strategy into a measurable plan rather than a hopeful guess.
Position Sizing and Trading Psychology
Position size should be calculated from your stop distance and the amount you are willing to lose, not from how confident you feel. Overconfidence after a win streak and revenge trading after a loss are common psychological traps. Keep a trading journal recording entries, exits, reasons,asons and emotions, then review it regularly to find patterns in your mistakes. Take breaks when frustrated and avoid chasing moves that have already run. Discipline is difficult but trainable, and it separates sustainable traders from impulsive ones. A good Chainlink trading strategy is only as effective as the person following it, so treat psychology as a core skill.
FAQs
1. What is the best Chainlink trading strategy for beginners?
Beginners can start with a simple approach: mark support and resistance zones, trade only confirmed breakouts in the direction of the trend, and use a defined stop-loss on every position.
2. Which indicators work best for LINK?
Moving averages, RSI, and volume are popular choices. They help confirm momentum and breakout strength, but they work best when combined with price action rather than used alone.
3. How much should I risk per LINK trade?
Many traders risk only one to two percent of their account per trade. The right amount depends on your experience and tolerance, but small, consistent risk protects your capital.
4. Is Chainlink a good asset for trading?
LINK has solid liquidity and clear technical levels, which many traders like. Like all crypto assets, it is volatile and carries real risk, so trade carefully.
Conclusion on Chainlink Trading Strategy
A reliable Chainlink trading strategy combines an understanding of LINK’s fundamentals, clearly marked breakout zones, a few trusted indicators, and strict risk levels. Wait for confirmation, respect the broader market trend, and always define your stop-loss before you enter. No strategy removes risk entirely, so test your approach, keep a journal, and adapt as conditions change. For more trading guides and crypto news, continue exploring cryptofylab.com. This content is educational and does not constitute financial advice.
