



Hyperliquid has become one of the most watched names in crypto derivatives, and traders now want a clear HYPE trading analysis before they place new orders. HYPE hit an all-time high near $88 in September 2026, and open interest climbed to $14.3 billion. However, price alone never tells the full story. This guide breaks down open interest, volume, funding, and the key price zones that matter most. You will also find a risk plan, four FAQs, and a final takeaway. Read it, compare it with live charts, and build your own view. Explore more crypto market guides on CryptofyLab.
What Is Hyperliquid and Why Does HYPE Matter?
Hyperliquid runs a decentralized perpetual futures exchange on its own Layer 1 blockchain. Traders open leveraged positions without a traditional intermediary, and the platform settles every trade on-chain. The HYPE token sits at the center of this system. Hyperliquid routes a large share of trading fees into HYPE buybacks, so exchange activity directly influences token demand. Therefore, a serious Hyperliquid HYPE trading analysis must track platform metrics, not only candlesticks. Open interest, volume, and fee revenue each show a different side of demand. Meanwhile, price charts reveal where buyers and sellers actually fight. Together, these tools give you a stronger edge than headlines alone ever could.
HYPE Price Journey From $27 to $88
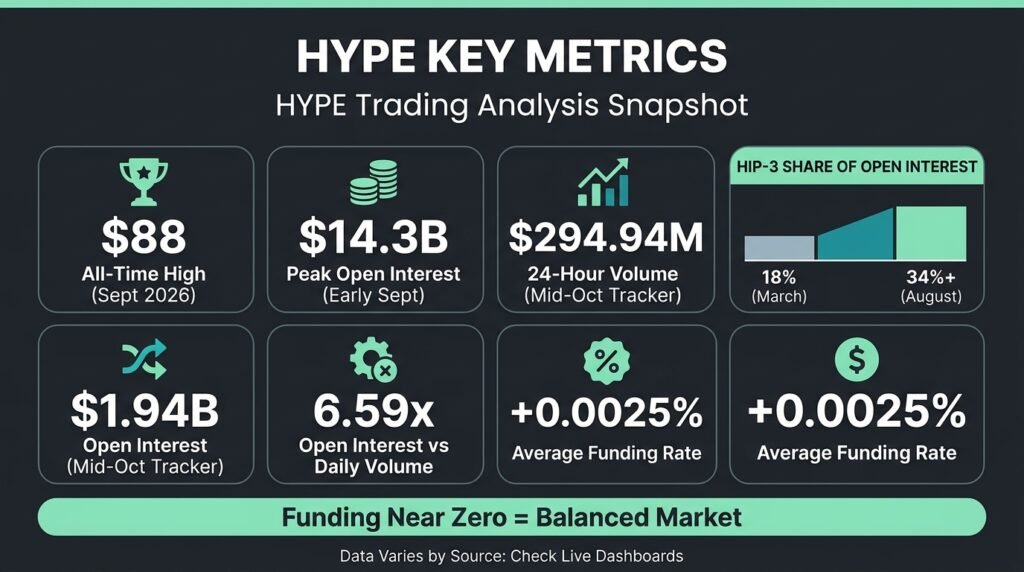
HYPE traded near $27 in January 2026, according to market reports. By March, the token pushed to $40 and became one of the best performers among the top 20 assets. Then September arrived, and HYPE reached an all-time high near $88. The token gained more than 50% in that single month, and its market cap approached $20 billion. In mid-October, a futures tracker showed the perpetual contract near $84.74. As a result, HYPE now trades close to its peak. This structure tells you that buyers still defend high prices, although volatility remains extreme.
Open Interest Basics for HYPE Traders
Open interest counts the total value of all active derivative contracts that traders have not closed. Rising open interest means new money enters the market. Falling open interest means traders close positions or the exchange liquidates them. When price rises and open interest rises together, fresh buyers usually drive the trend. However, when price rises while open interest falls, short sellers often cover, and the move can fade quickly. Therefore, you should always read open interest next to price. This pairing helps you separate healthy trends from short squeezes. HYPE traders who ignore this relationship often chase moves that already lost momentum.
How Open Interest Reached $14.3 Billion
In early September 2026, Hyperliquid’s total open interest reached $14.3 billion, according to The Block. That figure sat within 3% of the level from the day before the October 2025 crash. Two catalysts fueled the rise. First, Coinbase began routing Base App users to Hyperliquid in mid-August, which opened a new retail funnel. Second, President Trump said the CFTC is working on a compliant onshore bridge for Hyperliquid. As a result, traders returned in force. Open interest recovered fast because confidence recovered fast. Still, high open interest also raises liquidation risk, so you should treat these moments with care.
Why HIP-3 Changes the Open Interest Mix
HIP-3 lets builders launch permissionless perpetual markets on Hyperliquid, including commodities and tokenized assets. Its share of total open interest grew from 18% in March 2026 to over 34% by August. That shift matters for HYPE holders. Core crypto perpetuals route close to 97% of their fees into HYPE buybacks, while HIP-3 markets deliver less direct benefit. Consequently, a dollar of crypto perp open interest supports the token more than a dollar from a builder market. Therefore, watch the composition of open interest, not just the headline number. Quality matters as much as quantity, and smart traders check both.
Volume Analysis: What Trading Activity Reveals
Volume measures how much value changes hands during a period. High volume confirms conviction, and low volume exposes weak moves. In late 2025, HYPE’s daily volume often surged toward $1 billion. By January 2026, volume cooled to roughly $247 million, and the market entered a quieter phase. Then the 2026 rally rebuilt interest. Traders should compare today’s volume with the recent average rather than judge it alone. For example, a breakout on thin volume often fails, while a breakout on rising volume usually holds. Volume therefore acts as the lie detector in every HYPE trading analysis.
Reading the October Volume Snapshot
A futures tracker showed $294.94 million in 24-hour volume against $1.94 billion in open interest in mid-October 2026. That tracker covers one data set, so other platforms report different totals. Still, the ratio teaches a useful lesson. Open interest stood at 6.59 times daily volume. This gap shows that traders hold positions for longer periods instead of flipping them quickly. Moreover, the funding rate sat near +0.0025%, which signals a balanced market. Always verify these numbers on live dashboards before you trade. Data changes by the minute, and old numbers mislead new decisions.
Funding Rates and Market Positioning
Funding rates keep perpetual contract prices close to spot prices. Positive funding means longs pay shorts, and negative funding means shorts pay longs. A very high positive rate signals crowded long positions, which often precede sharp pullbacks. A very negative rate signals crowded shorts and sometimes fuels squeezes. In October 2026, HYPE’s average funding sat near +0.0025%, which indicates balance. Therefore, neither side dominated the trade. This balance reduces the immediate risk of a violent liquidation cascade. However, funding can flip within hours, so check it before every entry and again before you hold a position overnight. Additionally, compare HYPE funding with Bitcoin and Ethereum funding. If HYPE funding runs far above the majors, speculative demand dominates, and a reset often follows. If it runs below them, the market treats HYPE with caution, and a recovery rally can surprise late sellers. This cross-check takes one minute and adds real context to every setup you plan.
Key Price Zones in HYPE Trading Analysis
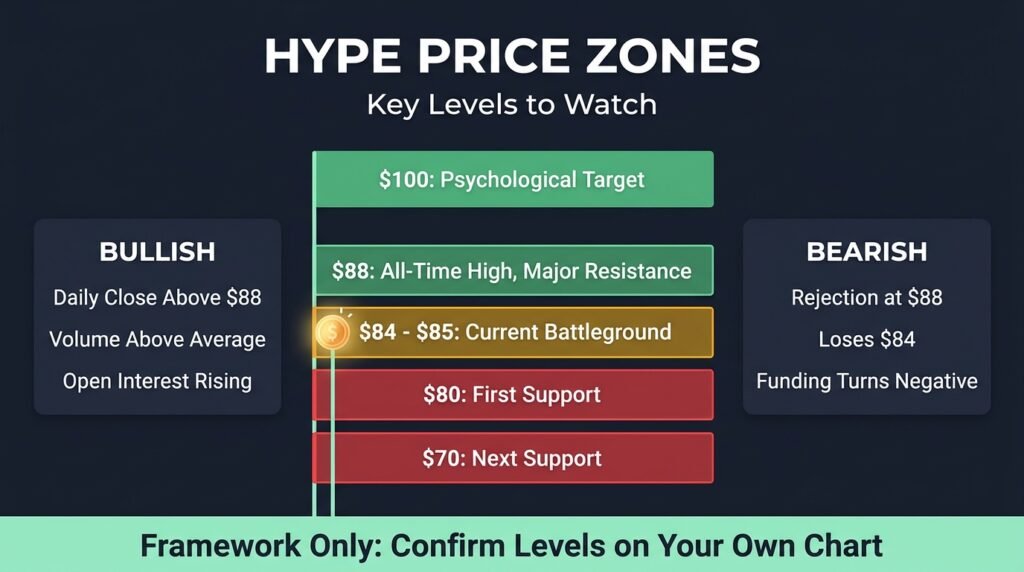
Price zones show where buyers and sellers repeatedly act. Traders draw them from past highs, past lows, and round numbers. For HYPE, the September all-time high near $88 forms the most important ceiling. The $84 to $85 area, where the perpetual traded in mid-October, forms the current battleground. Below that, round numbers such as $80 and $70 offer logical support. Above it, $100 serves as a psychological target. This article builds these zones from reported price points and round-number logic, so treat them as a framework, not a promise. Always confirm them on your own chart.
Resistance Zone: $88 to $100
The $88 all-time high acts as the first major resistance. Sellers who bought early often take profit near fresh highs, and late buyers often hesitate there. A clean daily close above $88 with strong volume would signal a new price-discovery phase. In that case, the $100 level becomes the next magnet because traders love round numbers. However, a rejection at $88 with falling volume would warn of exhaustion. Watch how price reacts on the first retest. A fast rejection often leads to a pullback, while a slow grind through the zone suggests real demand. Also compare the candle bodies with their wicks. Long upper wicks show that sellers hit price hard, while strong closes near the highs show that buyers keep control.
Support Zone: $80 to $70
The $80 area offers the first logical support below the current range. Buyers often defend round numbers, and many stop orders cluster nearby. If $80 breaks, the $70 zone becomes the next area to watch. A drop that deep would erase a large part of the September rally, and open interest would likely fall as traders close positions. Therefore, watch open interest during any decline. A price drop with rising open interest signals aggressive shorting, while a drop with falling open interest signals liquidation or profit-taking. Each pattern leads to different follow-up moves.
Bullish Scenario: Breakout With Rising Open Interest
A bullish setup needs three signals at once. Price must close above $88, volume must exceed its recent average, and open interest must rise without extreme funding. When all three align, new capital backs the trend, and the odds of continuation improve. Traders then often buy pullbacks toward the breakout level instead of chasing candles. They also place stops below that level to limit damage if the breakout fails. Meanwhile, you should scale out near $100 because round numbers attract heavy selling. Patience beats speed here, and a plan beats emotion in every HYPE trading analysis.
Bearish Scenario: Failed Breakout and Liquidations
A bearish setup starts when price rejects $88 and then loses $84. At that point, late longs panic, and liquidations can accelerate the drop. Funding often turns negative, and open interest falls sharply. Traders who sold the rejection then target $80 first and $70 second. However, a sharp flush can also create a strong bounce because forced sellers exhaust themselves. Therefore, avoid chasing a falling candle. Wait for a stabilizing close, and then judge whether buyers defend the zone. Discipline protects capital far better than guessing the exact bottom.
Revenue, Buybacks, and Fundamental Support
Technical zones matter more when fundamentals back them. Hyperliquid’s gross revenue peaked at $457 million in the third quarter of 2025 and fell to $202 million by the second quarter of 2026. Assistance Fund purchases fell from $290 million to $149 million over the same period. These declines show that buyback support cooled even as price climbed. However, the September surge in open interest suggests activity is recovering. If crypto perpetual open interest keeps growing, buybacks should rise again. Therefore, track quarterly revenue and Assistance Fund data alongside your charts to confirm trend strength. Learn more in our crypto trading basics.
Risk Management for HYPE Perpetual Trading
HYPE moved over 50% in a single month, so leverage can destroy accounts fast. Risk only a small percentage of your capital on each trade. Place stop-loss orders before you enter, and size positions so one loss never hurts badly. Avoid high leverage near all-time highs because volatility spikes there. Also, skip trading during major news without a plan. Beginners should practice on spot markets or low leverage first. In addition, track liquidation maps and funding on CoinGlass. Moreover, write a trade journal. Record your entry reason, your stop, your target, and the result, and review it weekly. This habit exposes repeated mistakes faster than any indicator can. Remember that no analysis predicts the future, and this article offers education, not financial advice.
Frequently Asked Questions About HYPE Trading Analysis
What does open interest tell me about HYPE?
Open interest shows how much money sits in active HYPE derivative contracts. Rising open interest with rising price usually confirms fresh buying. Falling open interest during a rally often warns that short covering, not new demand, drives the move.
What are the key HYPE price zones right now?
The $88 all-time high acts as major resistance, and $100 serves as the psychological target. On the downside, $84 to $85, $80, and $70 form the main support areas. Confirm each level on a live chart.
Does high volume guarantee a HYPE breakout?
No. High volume improves the odds, but it never guarantees a result. Combine volume with open interest, funding rates, and a clean candle close above resistance before you trust any breakout.
Is HYPE a safe investment?
HYPE carries high risk. The token gained over 50% in one month, and it can lose value just as quickly. Research carefully, use stop-losses, and never risk money you cannot afford to lose.
Final Thoughts
Hyperliquid’s growth story is strong, but disciplined traders still need data, not hype. Open interest near $14.3 billion shows renewed demand, while volume and funding show how healthy that demand looks. The $88 high, the $84 to $85 range, and the $80 and $70 support give you a clear map. Combine that map with strict risk rules, and you will trade with more confidence. Keep studying, keep checking live metrics, and visit CryptofyLab for more crypto market analysis.
