



Bitcoin technical analysis helps traders read price action without guessing. Bitcoin moves fast, and emotion often drives the costliest mistakes. Charts give you a structured way to see where buyers step in, where sellers push back, and which direction the next big move may take. This guide explains support and resistance, shows the indicators that matter, and walks through three breakout scenarios for BTC. You will also learn how to protect your capital when the market surprises you. Read on to build a clear plan before your next trade.
What Is Bitcoin Technical Analysis and Why Does It Matter?
Bitcoin technical analysis studies historical price and volume data to estimate future market behavior. Traders draw lines on charts, track indicators, and look for repeating patterns. The method works well in crypto because Bitcoin trades around the clock, which produces a constant stream of data. Technical analysis cannot predict the future with certainty, but it tilts the odds in your favor. It also forces you to define your entry, your exit, and your risk before you click the buy button. Many professionals combine it with news and on-chain data for a fuller picture. You can follow daily market updates on Crypto Fy Lab.
Bitcoin Technical Analysis: How Support Levels Work
A support level marks a price zone where buyers repeatedly step in and stop a decline. Bitcoin often bounces from these zones because traders place their buy orders there. The more times price tests a level and holds, the stronger that level becomes. Round numbers, previous swing lows, and long-term moving averages commonly act as support. When price breaks below support on heavy volume, the old floor often turns into a new ceiling. Mark support as a zone instead of a single line, because Bitcoin rarely reverses at one exact price. Use the weekly chart to find the strongest zones, then zoom into the daily chart for precise entries.
How Bitcoin Resistance Levels Work
Resistance forms where sellers overpower buyers and push price back down. Previous highs, psychological round numbers, and falling trendlines often create these barriers. Each rejection teaches the market that sellers defend that zone. When Bitcoin finally closes above resistance with strong volume, the barrier often flips into fresh support. Traders watch the candle close instead of the wick, because a brief spike above a level proves very little. Patience matters here, since false breakouts trap impatient buyers in every cycle. Study the Investopedia guide to support and resistance to sharpen these skills.
Key Indicators for Bitcoin Technical Analysis
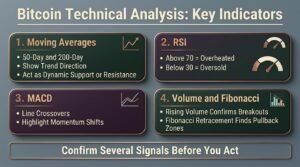
Indicators confirm what price already shows. The 50-day and 200-day moving averages reveal the trend direction and often act as dynamic support or resistance. The Relative Strength Index measures momentum, with readings above 70 signaling overheated conditions and readings below 30 signaling oversold ones. The MACD highlights momentum shifts when its lines cross. Volume tells you whether real money backs a move, so rising volume on a breakout adds confidence. Fibonacci retracement levels help you spot likely pullback zones inside a trend. Load these tools on TradingView and confirm that several signals agree before you act.
Bullish Breakout Scenario for Bitcoin
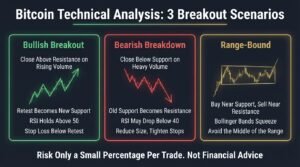
In the bullish scenario, Bitcoin pushes through a major resistance zone and closes above it on rising volume. Buyers then defend the old resistance as new support, which confirms the breakout. Momentum indicators usually climb alongside price, and the RSI holds above 50 without a sharp bearish divergence. Many traders wait for a retest of the broken level before they enter, because that retest lowers their risk. A common target adds the height of the prior range to the breakout point. Strong ETF inflows and steady on-chain accumulation often fuel this kind of move. Place your stop loss just below the retested level, so a failed breakout costs you little.
Bearish Breakdown Scenario for Bitcoin
The bearish scenario starts when Bitcoin loses a key support zone and closes below it with heavy volume. Sellers then treat the old floor as a new ceiling, and every bounce meets resistance. Lower highs and lower lows confirm that the downtrend has control. Price often slides toward the next support zone, such as the 200-day moving average or a prior consolidation area. Momentum indicators typically weaken, and the RSI may drop below 40. Leveraged long positions often liquidate in this phase, which speeds up the decline. Reduce your size, tighten your stops, and wait for a clear reversal pattern before you buy the dip.
Range-Bound Scenario for Bitcoin
Bitcoin spends a surprising amount of time moving sideways between support and resistance. In a range, price bounces between two clear boundaries while volume fades. Traders buy near support, sell near resistance, and keep their stops tight. Bollinger Bands narrow during these periods, and that squeeze often warns of a coming volatility spike. Avoid forcing trades in the middle of the range, because the reward rarely justifies the risk. Instead, mark the boundaries, set price alerts, and let the market come to you. The breakout from a long range usually produces the strongest trends, so patience pays well.
Risk Management in Bitcoin Technical Analysis
Even the best chart setup fails sometimes, so risk management decides who survives. Risk only a small percentage of your account on each trade, and set your stop loss before you enter. Avoid high leverage, because Bitcoin can swing several percent within an hour. Size your position by the distance to your stop, not by your excitement. Keep a trading journal so you learn from every win and every loss. Check live prices and market data on CoinGecko before you place orders. Read more beginner-friendly breakdowns in our crypto trading guides.
FAQs
What is the best Bitcoin technical analysis indicator for beginners?
Moving averages and the RSI give beginners the clearest signals. Moving averages show the trend, and the RSI shows momentum. Start with these two tools, then add volume once you feel comfortable. Avoid stacking too many indicators, because conflicting signals create confusion.
How do I find Bitcoin support and resistance levels?
Look for price zones where Bitcoin reversed several times in the past. Draw horizontal zones across swing highs and swing lows on the daily and weekly charts. Add moving averages and round numbers as extra confirmation. The more often price reacts to a zone, the stronger that zone becomes.
Can technical analysis predict Bitcoin breakouts?
Technical analysis cannot predict breakouts with certainty, but it highlights high-probability setups. Volume, candle closes, and retests help you separate real breakouts from fakeouts. News events and sudden liquidations can still override any pattern. Always trade with a stop loss and a clear plan.
Final Thoughts
Bitcoin technical analysis gives traders a repeatable framework for support, resistance, and breakout decisions. Support zones show where buyers defend price, and resistance zones show where sellers push back. Three scenarios, bullish, bearish, and range-bound, cover most of what the chart can do next. Confirm every signal with volume and candle closes, and manage risk on every trade. Visit Crypto Fy Lab for daily crypto news and market analysis. This post shares educational market information only, so make your own decisions and set your own risk limits.
