



Polygon trading analysis helps you read POL’s price action with a clear plan instead of emotion. The token moves fast, reacts to Bitcoin and Ethereum, and responds sharply to ecosystem news. Charts show where buyers step in, where sellers push back, and which direction the next big move may take. This guide explains key support and resistance zones, shows the indicators that matter, and walks through bullish, bearish, and sideways scenarios. You will also learn the risk rules that protect your capital when the market surprises you. Read on to build a calm, clear trading plan.
What Is Polygon (POL) and Why Do Traders Watch It?
Polygon began as Matic Network in 2017 and grew into one of the most used Ethereum scaling networks. The team rebranded the ecosystem and replaced the MATIC token with POL in 2024. Holders converted MATIC to POL at a one-to-one rate through the official migration. POL powers staking, secures the network, and supports the wider Polygon ecosystem. Validators stake POL to confirm transactions and earn rewards in return. Developers build payments, gaming, DeFi, and real-world asset apps on Polygon. Big brands have also tested the network for loyalty programs and digital collectibles. Low fees and fast confirmations make the chain attractive for everyday transactions. Traders watch POL because it reacts to Ethereum trends, ecosystem news, and broader market mood. The coin trades on major exchanges, which gives it deep liquidity and tight spreads. Visit the official Polygon website to explore the roadmap and tools directly.
Polygon Trading Analysis: Market Overview and Fundamentals
Polygon trading analysis starts with the big picture before you draw a single line. POL sits among the established altcoins, so it usually follows Bitcoin and Ethereum. When Bitcoin rallies, POL often rises, and when Bitcoin drops, POL often falls harder. Ethereum’s health matters even more, because Polygon scales Ethereum and competes with other Layer 2 networks. Network upgrades and new partnerships can lift sentiment for days or weeks. Token supply changes and staking updates can also shift demand. Competition from Arbitrum, Base, Optimism, and Solana keeps pressure on market share. Fundamental news sets the mood, while charts show where buyers and sellers act. Strong traders combine both views and avoid trading on headlines alone. Check live price, volume, and supply data on CoinGecko’s POL page before you plan any trade.
How Support Levels Work for POL
A support level marks a price zone where buyers repeatedly stop a decline. POL often bounces from these zones because traders place buy orders there. Each successful test makes the zone stronger, until a breakdown proves it wrong. Previous swing lows, round numbers, and long-term moving averages commonly act as support. Mark support as a zone instead of a single line, because price rarely reverses at one exact tick. Use the weekly chart to find the strongest zones, then zoom into the daily chart for precise entries. Heavy volume at a support zone shows that buyers defend it with real money. A close below support on strong volume warns that sellers have taken control. After a breakdown, the old support often flips into resistance. Wait for a candle close before you call a level broken, because wicks fool many traders. Study the Investopedia guide to support and resistance to sharpen these skills.
How Resistance Levels Work for POL
Resistance forms where sellers overpower buyers and push price back down. Previous highs, round numbers, and falling trendlines often create these barriers. Each rejection teaches the market that sellers defend that zone. POL often stalls near resistance and then drifts sideways while traders decide. When price closes above resistance with strong volume, the barrier often flips into fresh support. Traders watch the candle close instead of the wick, because a brief spike proves little. False breakouts trap impatient buyers in every market cycle. Look for a retest of the broken level before you trust the move. Falling volume during a push toward resistance often warns of a weak rally. Rising volume during the push suggests that real demand supports the move.
Polygon Trading Analysis: Key Indicators to Use
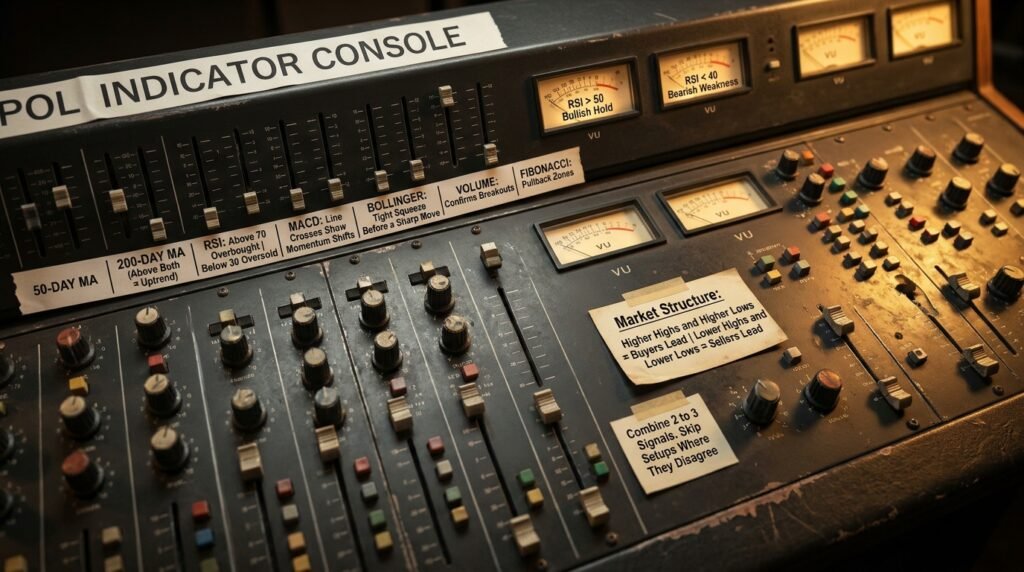
Indicators confirm what price already shows, so use them as a second opinion. Polygon trading analysis gets stronger when you pair a few simple tools with your levels. The 50-day and 200-day moving averages reveal the trend and often act as moving support or resistance. A price above both averages signals a healthy uptrend, while a price below both signals weakness. The Relative Strength Index measures momentum, with readings above 70 suggesting overbought conditions and readings below 30 suggesting oversold ones. The MACD highlights momentum shifts when its lines cross. Bollinger Bands show volatility, and a tight squeeze often comes before a sharp move. Volume tells you whether real money backs a breakout, so never ignore it. Fibonacci levels help you spot where price may pull back inside a trend. Combine two or three signals, and skip any setup where they disagree. Load these tools on TradingView and test them on POL’s past moves.
 Polygon Trading Analysis: Reading Volume and Market Structure
Market structure tells you who controls the trend. Higher highs and higher lows show that buyers lead the market. Lower highs and lower lows show that sellers lead. A break of the last higher low often warns that an uptrend may end. A break of the last lower high often warns that a downtrend may end. Volume adds weight to every structure break, so compare each move with average volume. A rally on falling volume often fades, while a rally on rising volume often continues. Multi-timeframe analysis helps too, because the daily trend often overrides hourly noise. Trade in the direction of the higher timeframe trend whenever you can. Futures funding rates reveal how crowded leveraged trades have become, and extreme readings often precede sharp reversals.
Bullish Breakout Scenario in Polygon Trading Analysis
In the bullish scenario, POL pushes through a major resistance zone and closes above it on rising volume. Buyers then defend the old resistance as new support, which confirms the breakout. Momentum indicators usually climb alongside price, and the RSI stays above 50 without a sharp drop. Many traders wait for a retest of the broken level before they enter, because that retest lowers risk. A common target adds the height of the prior range to the breakout point. Ecosystem news, such as new partnerships and network upgrades, often fuels this kind of move. A strong Bitcoin and Ethereum market also helps POL extend its gains. Place your stop loss just below the retested level, so a failed breakout costs you little. Scale into the position in two or three steps instead of buying all at once. Take partial profits at the first target and trail your stop on the rest. Avoid chasing a candle that already moved far, because late entries carry the worst risk.
Bearish Breakdown Scenario for POL
The bearish scenario starts when POL loses a key support zone and closes below it with heavy volume. Sellers then treat the old floor as a new ceiling, and every bounce meets resistance. Lower highs and lower lows confirm that the downtrend has control. Price often slides toward the next support zone, such as the 200-day moving average or an earlier sideways zone. Momentum indicators typically weaken, and the RSI may drop below 40. Traders who borrowed to buy often lose their positions in this phase, which speeds up the decline. A weak Bitcoin market or negative Ethereum news can deepen the drop. Reduce your size, tighten your stops, and avoid catching a falling knife. Wait for a clear reversal pattern, such as a higher low with rising volume, before you buy. Short sellers should place stops above the broken support, and they should respect them.
Range-Bound Scenario for POL
POL spends long stretches moving sideways between support and resistance. In a range, price bounces between two clear boundaries while volume fades. Traders buy near support, sell near resistance, and keep their stops tight. Bollinger Bands narrow during these periods, and that squeeze often warns of a sharp price swing. Avoid forcing trades in the middle of the range, because the reward rarely justifies the risk. Mark the boundaries, set price alerts, and let the market come to you. Watch for rising volume near either edge, because it often signals the next breakout. The breakout from a long range usually produces the strongest trends. False breakouts happen often at range edges, so wait for a close beyond the boundary. Patience pays well in this scenario, because overtrading drains accounts through fees.

Polygon Trading Analysis: Risk Management Rules
Even the best Polygon trading analysis fails sometimes, so risk management decides who survives. Risk only a small percentage of your account on each trade, such as one or two percent. Set your stop loss before you enter, and never move it further away. Size your position by the distance to your stop, not by your excitement. Avoid high leverage, because POL can swing several percent within an hour. Keep a cash reserve in a stablecoin so you can buy dips without selling other assets. Diversify across several assets instead of betting everything on one altcoin. Avoid trading when you feel angry, tired, or euphoric. Keep a trading journal, and review it every month to learn from wins and losses. Read our crypto trading guides for more risk control basics. Protecting capital matters more than chasing profit.
Fundamental Catalysts That Can Move POL
Charts show where price may move, but news often decides when it moves. Network upgrades that raise speed or cut fees can lift sentiment quickly. New partnerships with payment firms, banks, or large brands add credibility. Growth in stablecoin volume and real-world asset tokenization on Polygon supports long-term demand. Staking participation and token supply changes affect how many coins reach the market. Ethereum upgrades influence Polygon, because both networks compete and cooperate. Exchange listings and delistings change liquidity and can trigger sharp moves. Regulatory news about altcoins and staking can hit prices across the sector. Follow official announcements and trusted outlets, and ignore rumors from anonymous accounts. Read our crypto market analysis for daily updates and context.
FAQs
What is Polygon trading analysis and how does it work?
Polygon trading analysis studies POL’s price, volume, and indicators to find likely support, resistance, and breakout zones. Traders mark key levels, confirm them with momentum tools, and plan entries and exits in advance. It improves your odds, but it never guarantees an outcome.
Which indicators work best for POL?
Moving averages, the RSI, and volume give the clearest signals for most traders. Add the MACD or Bollinger Bands once you feel comfortable. Avoid stacking too many tools, because conflicting signals create confusion.
How do I find POL support and resistance levels?
Look for price zones where POL reversed several times in the past. Draw horizontal zones across swing highs and swing lows on the daily and weekly charts. Add moving averages and round numbers as extra confirmation.
Is POL a good long-term investment?
POL offers an established ecosystem, active developers, and real-world partnerships. Its price still swings sharply, and rival networks compete hard for users. Research the project, spread your risk, and invest only what you can afford to lose.
Final Thoughts
Polygon trading analysis gives you a repeatable framework for support, resistance, and breakout decisions. Support zones show where buyers defend price, and resistance zones show where sellers push back. Bullish, bearish, and range-bound scenarios cover most of what POL can do next. Confirm every signal with volume and candle closes, and manage risk on every trade. Visit Crypto Fy Lab for daily crypto news and analysis. This post shares educational information only, so make your own decisions and set your own risk limits.
