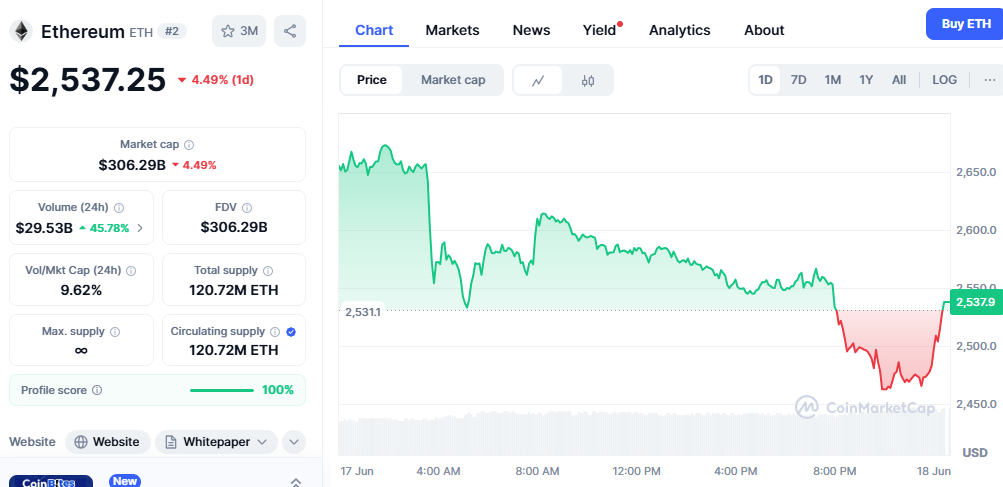
Ethereum (ETH) remains within its six-week consolidation range, while institutional investors and whale addresses accumulate substantial positions. The world’s second-largest cryptocurrency trades at $2,557 at press time, marking a 2.3% decline over the past 24 hours. However, technical analysis suggests a significant 35% price rally may be approaching as Ethereum nears a critical golden crossover pattern.
Golden Cross Formation Signals Bullish Ethereum Price Momentum
Ethereum price analysis reveals a golden cross pattern forming on the daily chart, driven by the 50-day exponential moving average (EMA) climbing steadily toward the 200-day EMA. This technical indicator emerges as whale accumulation and short-term holder confidence build substantial bullish momentum across the Ethereum network.
The 50-day EMA is now approaching the 200-day EMA level, creating conditions for a golden cross signal that historically triggers significant price movements. When these moving averages intersect, with the shorter-term average crossing above the longer-term average, it typically signals the beginning of sustained upward price action.
Historical data supports the bullish Ethereum price prediction. The last golden cross formation occurred in November 2024, immediately preceding a remarkable 35% price surge within days. During that rally, the Ethereum price rocketed from $3,000 to $4,000 in just a few weeks, demonstrating the powerful momentum these technical signals can generate.
Ethereum Price Target: $3,454 Within Reach
If current market conditions mirror the November 2024 pattern, Ethereum could break above its consolidation zone and target $3,454 in the near term. This price level would represent the highest valuation for the leading altcoin since January 2025, marking a significant milestone for investors and the broader cryptocurrency market.

The technical setup appears increasingly favorable as both institutional investors and retail participants position for potential upside. Whale activity has reached levels not seen since 2017, according to recent Glassnode data, while ETH inflows have hit four-month highs across major exchanges.
RSI Indicator Presents Key Challenge for Bulls
Despite the optimistic technical outlook, the Relative Strength Index (RSI) reveals a potential obstacle to the bullish Ethereum price forecast. Currently sitting at 51, the RSI indicates neutral territory where buying and selling pressures remain balanced rather than showing decisive bullish momentum.
This near-neutral RSI reading suggests that Ethereum requires stronger buying support to sustain a breakout above its current resistance levels. Without increased purchasing pressure, the anticipated golden cross signal may fail to generate the expected price rally.
Institutional Accumulation Drives Ethereum Network Growth
Whale accumulation patterns strongly support the bullish Ethereum price analysis. Large addresses continue to purchase Ethereum Surges tokens despite short-term price volatility, creating substantial demand pressure that could fuel the next significant price movement.
Glassnode’s latest research confirms whale buying activity has reached its highest level since 2017, coinciding with ETH inflows hitting four-month peaks. This institutional accumulation occurs while retail traders appear more focused on profit-taking, creating an interesting dynamic between different market participant categories.
Binance Traders Position for Ethereum Price Surge
Futures market data from Coinglass reveals a notable shift in trader sentiment toward bullish Ethereum positions. The long/short ratio on Binance exchange has climbed to 66% long positions versus 33% short positions, indicating most traders expect continued price gains.
Beyond Binance, whale traders on the Hyperliquid platform have opened more than $3.6 million in long positions over the past 24 hours. These large-scale investors maintain their bullish positions despite experiencing unrealized losses, suggesting firm conviction in Ethereum’s medium-term price potential.
Market Outlook: Multiple Catalysts Align for Ethereum
The convergence of technical indicators, institutional accumulation, and positive trader sentiment creates a compelling case for Ethereum’s next price movement. The approaching golden cross formation, combined with unprecedented whale activity and bullish futures positioning, suggests significant upward momentum may be building.
However, investors should closely monitor the RSI indicator, as sustained buying pressure above current levels remains necessary to confirm the bullish breakout scenario. The balance between retail profit-taking and institutional accumulation will likely determine whether Ethereum can achieve its $3,454 price target.
Ready to capitalize on Ethereum’s potential 35% rally? Stay informed about the latest cryptocurrency market developments and technical analysis by following our expert insights. Don’t miss the next significant price movement – subscribe to our newsletter for real-time Ethereum price alerts and professional trading strategies that could help you navigate this exciting market opportunity.


